City Street Safety - Who's in Charge?
A few days back we talked about the important of aligning responsibility with authority, and providing incentives for resolving issues. Let's think back to the Safety Pyramid and pretend that we want to shrink the pyramid, reducing traffic fatalities, injuries, crashes, and the rest. Hey - we just reinvented VisionZero, right? How do we go from a simple vision to actionable reality?
We need a strategy that all can get behind, and then a strategy deployment effort that lines up goals, initiatives, incentives, and tracking for the various departments on down to individuals.
But wait, it's already pretty obvious that killing and maiming people is bad, right? Why are deaths already occurring? Surely SOMEBODY is responsible to ensure people don't die, aren't they?
If I look at my city's website, there isn't any mention of health or safety on the main page, except for a COVID link and an animal welfare link, but there is a Traffic Map link. If I pick through menu items, under "residents" I find links for another COVID item, Transportation, and Public Safety.
- Transportation has links to a walk-bike site, but a browser page won't open as it's unsecure and "might be trying to steal your information".
- Another "Connect" link to the 311 service to report minor public issues fails entirely.
- Public Safety has links to Police and Fire, and "Hazard Mitigation". Now that's something! Nope, it's a link for natural disaster planning and flood plain maps.
I look at City Departments, and find quite a list:
- Asset Management Department
- Communications Department
- Customer Care Center
- Development Services
- Engineering Services
- Finance Department
- Fire Department
- Human Resources
- Mayor’s Office of Resilience and Equity
- Information Technology
- Legal Department
- Municipal Courts
- Park and Recreation
- Police Department
- Streets and Stormwater Department
- Water and Sewer Department
- Working in Neighborhoods
Hmm...maybe it's not the City, but the County, that is responsible for health and general safety? The County has more about COVID, material about immunizations of all sorts, mosquito control, food safety/training/inspections, and some helpful links about community health (including an Active Lifestyles item with a broken link for Walking), a Healthy Living Program which supports smoking cessation, healthy eating, farmers markets, and physical activity.
- The county does indeed provide statistics on health topics and mortality, and that includes "accidental deaths" due to car crashes, but they are lumped in with poisoning (which includes drug overdoes) and falls. Still, it is something.
Frankly, none of this comes as a surprise, as having lived here for decades I already know that the general theme here is "you are responsible for yourself" and individual responsibility goes with individual cars for individual transportation to address individual needs and perhaps foster individual success....or failure.
Let's go back to our contrived Street Safety Pyramid and think about what it would take it make something like work here, shall we?

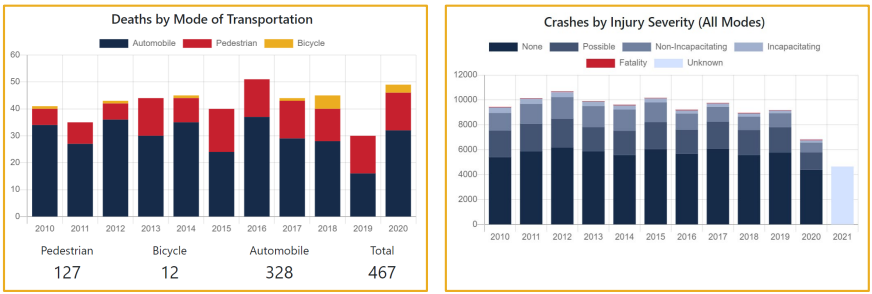
For serious traffic crashes, the police are general involved, and any meaningful data comes from their reporting. The state collects and publishes aggregate statistics, and does a reasonable job at this, but only the police report contains details like precise locations and any known narrative for the incident. These details are available to the City by convention and to others via FOIA requests. Resulting data shows the relative risks to pedestrians and cyclists, and the huge number of underlying crashes, as we expected from our pyramid model.
- Note that individual injuries involving falls or cycling crashes are probably invisible, if nobody calls police. Crashes that cause property damage may or may not be reported, especially on "Slick Streets" occasions where individuals must self-file any non-injury crash reports.
- All the illnesses and deaths that secondarily occur due to car-culture, like deaths from sedentary, obese lifestyles including diabetes, heart disease, organ diseases, and some cancer remain completely invisible, with no accounting whatsoever.
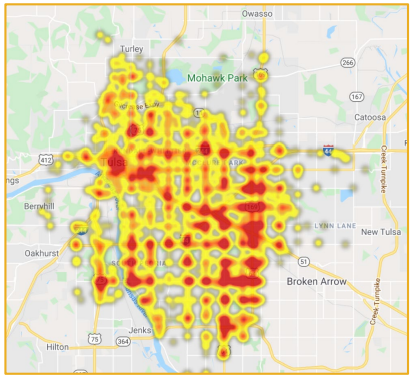
Once reported, the feedback path from crashes to identifying obviously dangerous locations where people have been injured or killed, to street design changes and implementation is long. To justify a change to improve safety, a pattern of danger has to be evident, with data being collected by police, then eventually analyzed by Streets if a maintenance issue contributes (say, worn striping or dead lighting) or to Engineering Services if a redesign is needed, which then needs to gain funding in a capital package in a yearly budget. Note that while data is imperfect and situations may differ, it's not hard to see the pattern of where crashes predominate (I helped a buddy with his effort to create a heat map).
If there is a broader desire for safer active transportation initiatives, it may come through government organizations like NHTSA and NACTO, which means a longer and more decoupled cycle still. Even when new standards, like Complete Streets, comes along, it will typically be factored only into new or rebuilt streets, which are relatively rare.
But wait, there is one more layer -- the "regional planning organizations" which cover the country. Ours is INCOG. They actually say "public safety" on their home page: "INCOG provides planning and coordination services to assist in creating
solutions to local and regional challenges in such areas as land use,
transportation, community and economic development, environmental
quality, public safety, and services for older adults." INCOG has excellent people and forward-looking plans, and they "own" the maps for sidewalk gaps and cycling routes plus related priorities and plans, crash maps, highway designations, and zoning. What they don't seem to have is direct spending authority or accountability to voters.
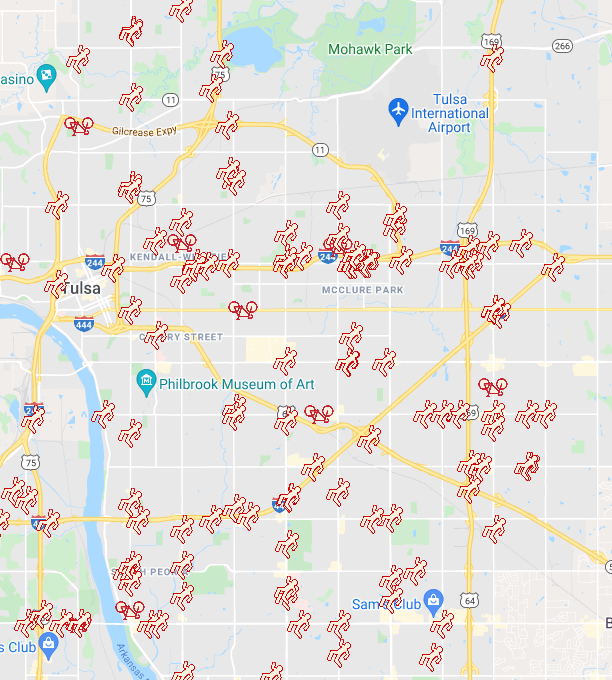
To help prioritize related items like repairing sidewalks or filling gaps, or (more recently) bikeways, here there are citizen organizations created as City-sponsored and INCOG-associated committees that provide input. These can be surprisingly capable, with motivated, knowledgeable, dedicated community members pushing for work they personally believe in. One such group filters out pedestrian and cycling crashes and deaths.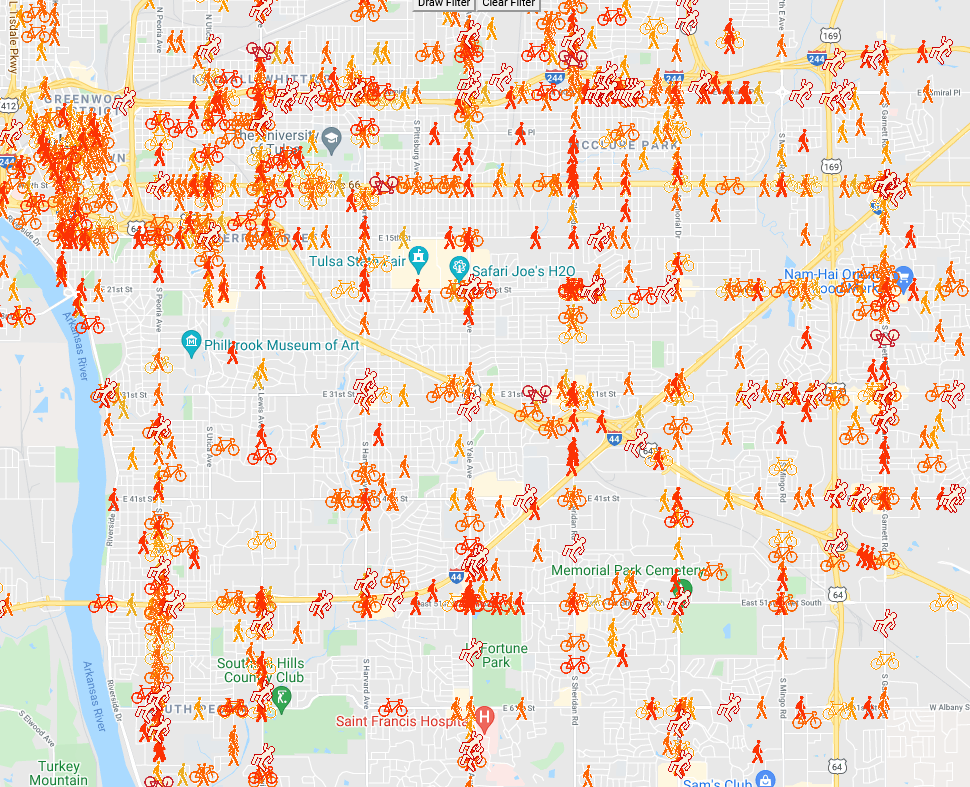
All of these feedback loops through three governmental agencies means any efforts to make meaningful changes are tortuously long and slow with plenty of bureaucracy, and between each silo there is a pass through city leadership and the Mayor's office or through state government, either of which filters and impacts priorities with each campaign cycle and community outcry.
Perhaps worst of all, these feedback paths that do exist mostly address the top two layers, and sometimes the third, but not the larger bottom layers. Minor individual incidents tend to be invisible, and near-misses and hazard conditions completely so unless a motivated citizen complains to their city councilor.. Until, that is, a fatality occurs and locals shake their heads and say, "we've been saying for years somebody was going to die at that crossing."
From the earliest days of scientific management it has been known that processes that are scrutinized tend to be improved, and even the act of monitoring will generally cause participants to increase productivity and reduce errors. It's possible to manage and improve processes without data, but it's neither easy nor efficient. It is also possible to ignore available data and NOT do what could be done.
So, we have some data, and we need more....but that's not what we really need most, is it? We're already in the other zone, of ignoring data we have.
Take a glance at the data sets above -- we already know a lot. Anybody can see where the crashes and deaths accumulate, and even postulate why. Look at the top left corner of the last two images -- the downtown area in the loop. There is a large cluster of crashes evident, and yet almost no deaths in 10 years despite more pedestrians and cyclists than anywhere else in town. The difference? This entire zone is now 20mph, down from 25, with decent sidewalks and marked bike lanes and clear stops with crossings at every block. Elsewhere, the crash-prevalent (and death-prevalent) arterials are generally 35mph and often driven faster, some with poor sidewalks and most with few mid-mile crossings. Highways are 60+mph unless congestion governs. Seems like the problem is pretty obvious, doesn't it?
Let's ruminate on these insights, and pick up here next blog.

Comments
Post a Comment